

|
|
|
|
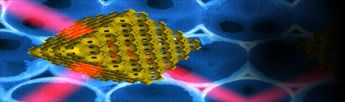
Optical cavities An optical cavity or optical resonator is an arrangement of mirrors that forms a standing wave cavity resonator for light waves.2 The most used implementation of an optical cavity is a laser. A laser cavity is an example of a macro cavity. Nowadays it is more a hot topic to do research on microcavities or even nanocavities. To confine an EM wave in an optical resonator, you can use three different methods. These methods are two metal mirrors, Total Internal Reflection (TIR) and Bragg Reflection (BR).3 If you want to construct a nanocavity, you can use a photonic crystal (figure 1). Structures in a photonic crystal have a periodic change of refractive index on the scale of the optical wavelength (figure 2). The confinement of waves in such a crystal is based upon TIR and BR.
The total Bragg reflectivity can amount almost 100%, because even on nanoscale there are sufficiently many atomic ‘mirror’ layers around the cavity. TIR is determined by the refractive index contrast and the incident angle of light at the interface between the cavity and the surrounding. It is not easy to design a cavity on nanoscale utilizing TIR3. Because it is so hard to compare these types of cavities, as a figure of merit the quality factor (Q-factor) of an optical cavity is introduced. The Q-factor is the ratio of the power inside the cavity and the power dissipated by the cavity, expressed as
where ν is the resonant frequency, ε is the stored energy in the cavity and
is the power dissipated. After photons are injected in a cavity, it is possible to measure the resonant spectrum of the light emitted from the cavity to free space, i.e. you measure the dissipated power P. The Q-factor of the cavity is inversely proportional to the linewidth (FWHM) of the resonance peak. The cavity used by Yoshie et al. has a very high Q-factor and is based upon a design of Noda's group. Figure 3 shows the results of the photoluminescence (PL) measurements from three nanocavities.
Click here to go to the section Quantum Dots. |